

Perfachhi / SDK
Oct 15, 2020


We fixed 45+ memory leaks and optimized our SDK & Apps

CTO, Nodle
We understood that the most important and easier way to fix the performance issues is from the time you compile the code till you get a go from the QA team. We optimised the parameters that could bother user retention
Add the SDK for the top most important parameters that developers requested from the community
We want to keep it as close to real-time to help you fix the performance issues on the go!
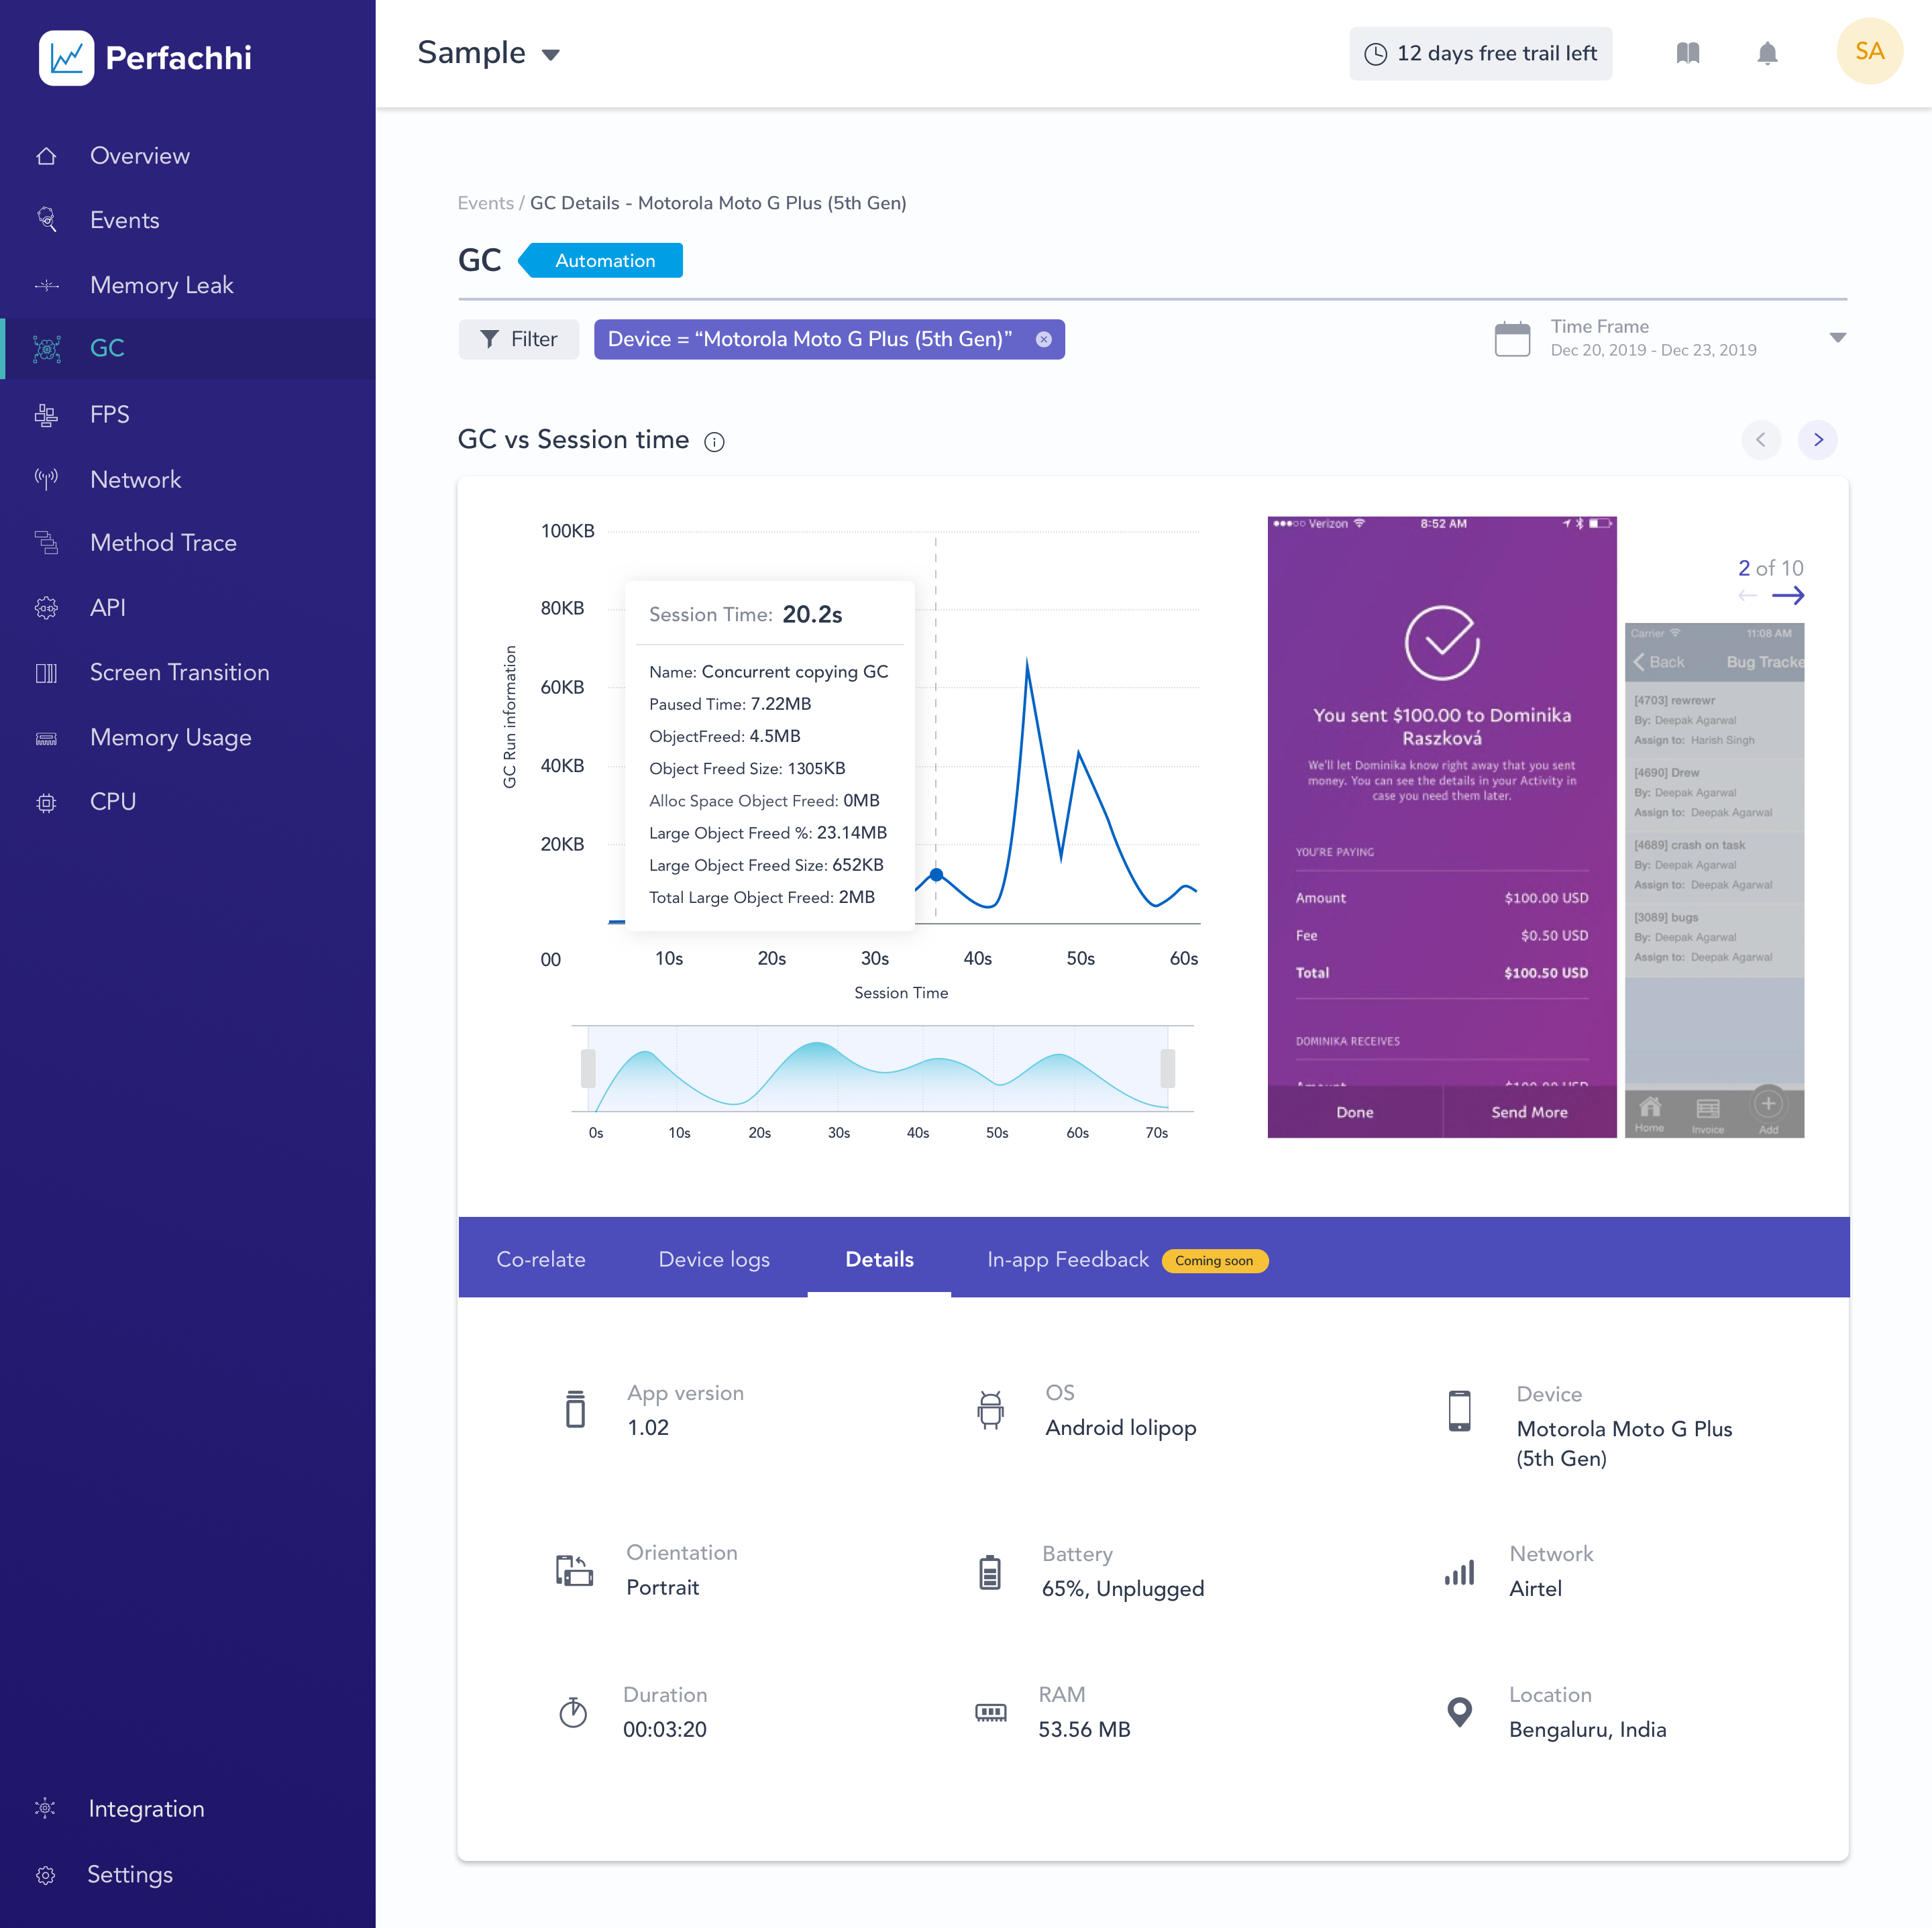
Perfacchi performance tool SDK lets you monitor all performance parameters of the app in test. Scanning all your performance data near real-time to provide feedback.
Simple Jitpack pull would easily integrate basic performance parameters such as Memory, CPU, Network, Memory leaks and would let you track based on devices.
Detailed reports with screenshots, logs, traces for you to compare and co-relate with Simple pane-view.
Tag your screens to understand the time taken to complete the loading of screens.
Detailed memory leaks with timeline lets you understand the areas to quickly fix.
Monitoring are tailored into session. We keep you close to real-time to bring the issues to be quickly actionable
We keep you updated about the issues on-screen during the testing. Bringing awareness is also our motto.
Get detailed feedback on the SDKs and Libraries that are deteriorating your app performance.
Timeline and metrics below each other for better understanding and co-relation of the metrics.
Get understanding of where and how of the spikes for debugging with a lot more context.
Battery consumption with the state of device in test. This is the most requested feature & we are working on it.